In computing, a data definition specification (DDS) is a guideline to ensure comprehensive and consistent data definition. It represents the attributes required to quantify data definition. A comprehensive data definition specification encompasses enterprise data, the hierarchy of data management, prescribed guidance enforcement and criteria to determine compliance. == Overview == A data definition specification may be developed for any organization or specialized field, improving the quality of its products through consistency and transparency. It eliminates redundancy (since all contributing areas are referencing the same specification) and provides standardization and degrees of compliance, making it easier and more efficient to create, modify, verify, analyze and share information across the enterprise. To understand how a data definition specification works in an enterprise, we must look at the elements of a DDS. Writing data definitions, defining business terms (or rules) in the context of a particular environment, provides structure for an organization's data architecture. In developing these definitions, the words used must be traceable to clearly defined data. A data definition specification may be used in the following activities: Business intelligence Business process modeling Business rules management Data analysis and modeling Information architecture Metadata modeling Data mastering Report generation == Criteria == A data definition specification requires data definitions to be: Atomic – singular, describing only one concept. Commonly used and ambiguous terms should be defined. While a term refers to one concept, several words may be used in a term: File – A concept identifiable with one word File extension – A concept identifiable with more than one word Traceable – Mapped to a specific data element. In business, a term may be traced to an entity (for example, a customer) or an attribute (such as a customer's name). A term may be a value in a data set (such as gender), or designate the data set itself. Traceability indicates relationships in the data hierarchy. Consistent - Used in a standard syntax; if used in a specific context, the context is noted Accurate - Precise, correct and unambiguous, stating what the term is and is not Clear - Readily understood by the reader Complete - With the term, its description and contextual references Concise - To avoid circular references == Applications == === Enterprise data === A data definition specification was produced by the Open Mobile Alliance to document charging data. The document, the centralized catalog of data elements defined for interfaces, specifies the mapping of these data elements to protocol fields in the interfaces. Created for the exchange of financial data, Market Data Definition Language (MDDL) is an XML specification designed to enable the interchange of information necessary to account, to analyze, and to trade financial instruments of the world's markets. It defines an XML-based interchange format and common data dictionary on the fields needed to describe: (1) financial instruments, (2) corporate events affecting value and tradability, and (3) market-related, economic and industrial indicators. The principal function of MDDL is to allow entities to exchange market data by standardizing formats and definitions. MDDL provides a common format for market data so that it can be efficiently passed from one processing system to another and provides a common understanding of market data content by standardizing terminology and by normalizing the relationships of various data elements to one another ... From the user perspective, the goal of MDDL is to enable users to integrate data from multiple sources by standardizing both the input feeds used for data warehousing (i.e., define what's being provided by vendors) and the output methods by which client applications request the data (i.e., ensure compatibility on how to get data in and out of applications)." === Clinical submissions === The Clinical Data Interchange Standards Consortium, a global, multidisciplinary, non-profit organization, has established standards to support the acquisition, exchange, submission and archiving of clinical research data and metadata. CDISC standards are vendor-neutral, platform-independent and freely available from the CDISC website. The Case Report Tabulation Data Definition Specification (define.xml) draft version 2.0, the oldest data definition specification, is part of the evolution from the 1999 FDA electronic submission (eSub) guidance and electronic Common Technical Document (eCTD) documents specifying that a document describing the content and structure of included data be included in a submission. Define.xml was developed to automate the review process by generating a machine-readable data-definition document. Define.xml has standardized submissions to the Food and Drug Administration, reducing review times from over two years to several months. === Archival data === A data definition specification is the foundation of metadata for scientific data archiving. The Metadata Encoding and Transmission Standard (METS) uses one principle of a DDS: consistent use of key terms to catalog digital objects for global use. The METS schema is a flexible mechanism for encoding descriptive, administrative and structural metadata for a digital library object and expressing complex links between metadata, and can provide a useful standard for the exchange of digital-library objects between repositories. A similar effort is underway to preserve complex data associated with video-game archiving. Preserving Virtual Worlds attempted to address archival-format deficiencies, citing the lack of suitable documentation for interactive fiction and games at the bit level: specifically, the absence of "representation information" needed to map raw bits into higher-level data constructs. Preserving Virtual Worlds 2 is a research project expanding on initial efforts in this field.
Shape context
Shape context is a feature descriptor used in object recognition. Serge Belongie and Jitendra Malik proposed the term in their paper "Matching with Shape Contexts" in 2000. == Theory == The shape context is intended to be a way of describing shapes that allows for measuring shape similarity and the recovering of point correspondences. The basic idea is to pick n points on the contours of a shape. For each point pi on the shape, consider the n − 1 vectors obtained by connecting pi to all other points. The set of all these vectors is a rich description of the shape localized at that point but is far too detailed. The key idea is that the distribution over relative positions is a robust, compact, and highly discriminative descriptor. So, for the point pi, the coarse histogram of the relative coordinates of the remaining n − 1 points, h i ( k ) = # { q ≠ p i : ( q − p i ) ∈ bin ( k ) } {\displaystyle h_{i}(k)=\#\{q\neq p_{i}:(q-p_{i})\in {\mbox{bin}}(k)\}} is defined to be the shape context of p i {\displaystyle p_{i}} . The bins are normally taken to be uniform in log-polar space. The fact that the shape context is a rich and discriminative descriptor can be seen in the figure below, in which the shape contexts of two different versions of the letter "A" are shown. (a) and (b) are the sampled edge points of the two shapes. (c) is the diagram of the log-polar bins used to compute the shape context. (d) is the shape context for the point marked with a circle in (a), (e) is that for the point marked as a diamond in (b), and (f) is that for the triangle. As can be seen, since (d) and (e) are the shape contexts for two closely related points, they are quite similar, while the shape context in (f) is very different. For a feature descriptor to be useful, it needs to have certain invariances. In particular it needs to be invariant to translation, scaling, small perturbations, and, depending on the application, rotation. Translational invariance comes naturally to shape context. Scale invariance is obtained by normalizing all radial distances by the mean distance α {\displaystyle \alpha } between all the point pairs in the shape although the median distance can also be used. Shape contexts are empirically demonstrated to be robust to deformations, noise, and outliers using synthetic point set matching experiments. One can provide complete rotational invariance in shape contexts. One way is to measure angles at each point relative to the direction of the tangent at that point (since the points are chosen on edges). This results in a completely rotationally invariant descriptor. But of course this is not always desired since some local features lose their discriminative power if not measured relative to the same frame. Many applications in fact forbid rotational invariance e.g. distinguishing a "6" from a "9". == Use in shape matching == A complete system that uses shape contexts for shape matching consists of the following steps (which will be covered in more detail in the Details of Implementation section): Randomly select a set of points that lie on the edges of a known shape and another set of points on an unknown shape. Compute the shape context of each point found in step 1. Match each point from the known shape to a point on an unknown shape. To minimize the cost of matching, first choose a transformation (e.g. affine, thin plate spline, etc.) that warps the edges of the known shape to the unknown (essentially aligning the two shapes). Then select the point on the unknown shape that most closely corresponds to each warped point on the known shape. Calculate the "shape distance" between each pair of points on the two shapes. Use a weighted sum of the shape context distance, the image appearance distance, and the bending energy (a measure of how much transformation is required to bring the two shapes into alignment). To identify the unknown shape, use a nearest-neighbor classifier to compare its shape distance to shape distances of known objects. == Details of implementation == === Step 1: Finding a list of points on shape edges === The approach assumes that the shape of an object is essentially captured by a finite subset of the points on the internal or external contours on the object. These can be simply obtained using the Canny edge detector and picking a random set of points from the edges. Note that these points need not and in general do not correspond to key-points such as maxima of curvature or inflection points. It is preferable to sample the shape with roughly uniform spacing, though it is not critical. === Step 2: Computing the shape context === This step is described in detail in the Theory section. === Step 3: Computing the cost matrix === Consider two points p and q that have normalized K-bin histograms (i.e. shape contexts) g(k) and h(k). As shape contexts are distributions represented as histograms, it is natural to use the χ2 test statistic as the "shape context cost" of matching the two points: C S = 1 2 ∑ k = 1 K [ g ( k ) − h ( k ) ] 2 g ( k ) + h ( k ) {\displaystyle C_{S}={\frac {1}{2}}\sum _{k=1}^{K}{\frac {[g(k)-h(k)]^{2}}{g(k)+h(k)}}} The values of this range from 0 to 1. In addition to the shape context cost, an extra cost based on the appearance can be added. For instance, it could be a measure of tangent angle dissimilarity (particularly useful in digit recognition): C A = 1 2 ‖ ( cos ( θ 1 ) sin ( θ 1 ) ) − ( cos ( θ 2 ) sin ( θ 2 ) ) ‖ {\displaystyle C_{A}={\frac {1}{2}}{\begin{Vmatrix}{\dbinom {\cos(\theta _{1})}{\sin(\theta _{1})}}-{\dbinom {\cos(\theta _{2})}{\sin(\theta _{2})}}\end{Vmatrix}}} This is half the length of the chord in unit circle between the unit vectors with angles θ 1 {\displaystyle \theta _{1}} and θ 2 {\displaystyle \theta _{2}} . Its values also range from 0 to 1. Now the total cost of matching the two points could be a weighted-sum of the two costs: C = ( 1 − β ) C S + β C A {\displaystyle C=(1-\beta )C_{S}+\beta C_{A}\!\,} Now for each point pi on the first shape and a point qj on the second shape, calculate the cost as described and call it Ci,j. This is the cost matrix. === Step 4: Finding the matching that minimizes total cost === Now, a one-to-one matching π ( i ) {\displaystyle \pi (i)} that matches each point pi on shape 1 and qj on shape 2 that minimizes the total cost of matching, H ( π ) = ∑ i C ( p i , q π ( i ) ) {\displaystyle H(\pi )=\sum _{i}C\left(p_{i},q_{\pi (i)}\right)} is needed. This can be done in O ( N 3 ) {\displaystyle O(N^{3})} time using the Hungarian method, although there are more efficient algorithms. To have robust handling of outliers, one can add "dummy" nodes that have a constant but reasonably large cost of matching to the cost matrix. This would cause the matching algorithm to match outliers to a "dummy" if there is no real match. === Step 5: Modeling transformation === Given the set of correspondences between a finite set of points on the two shapes, a transformation T : R 2 → R 2 {\displaystyle T:\mathbb {R} ^{2}\to \mathbb {R} ^{2}} can be estimated to map any point from one shape to the other. There are several choices for this transformation, described below. ==== Affine ==== The affine model is a standard choice: T ( p ) = A p + o {\displaystyle T(p)=Ap+o\!} . The least squares solution for the matrix A {\displaystyle A} and the translational offset vector o is obtained by: o = 1 n ∑ i = 1 n ( p i − q π ( i ) ) , A = ( Q + P ) t {\displaystyle o={\frac {1}{n}}\sum _{i=1}^{n}\left(p_{i}-q_{\pi (i)}\right),A=(Q^{+}P)^{t}} Where P = ( 1 p 11 p 12 ⋮ ⋮ ⋮ 1 p n 1 p n 2 ) {\displaystyle P={\begin{pmatrix}1&p_{11}&p_{12}\\\vdots &\vdots &\vdots \\1&p_{n1}&p_{n2}\end{pmatrix}}} with a similar expression for Q {\displaystyle Q\!} . Q + {\displaystyle Q^{+}\!} is the pseudoinverse of Q {\displaystyle Q\!} . ==== Thin plate spline ==== The thin plate spline (TPS) model is the most widely used model for transformations when working with shape contexts. A 2D transformation can be separated into two TPS function to model a coordinate transform: T ( x , y ) = ( f x ( x , y ) , f y ( x , y ) ) {\displaystyle T(x,y)=\left(f_{x}(x,y),f_{y}(x,y)\right)} where each of the ƒx and ƒy have the form: f ( x , y ) = a 1 + a x x + a y y + ∑ i = 1 n ω i U ( ‖ ( x i , y i ) − ( x , y ) ‖ ) , {\displaystyle f(x,y)=a_{1}+a_{x}x+a_{y}y+\sum _{i=1}^{n}\omega _{i}U\left({\begin{Vmatrix}(x_{i},y_{i})-(x,y)\end{Vmatrix}}\right),} and the kernel function U ( r ) {\displaystyle U(r)\!} is defined by U ( r ) = r 2 log r 2 {\displaystyle U(r)=r^{2}\log r^{2}\!} . The exact details of how to solve for the parameters can be found elsewhere but it essentially involves solving a linear system of equations. The bending energy (a measure of how much transformation is needed to align the points) will also be easily obtained. ==== Regularized TPS ==== The TPS formulation above has exact matching requirement for the pairs of points on the two shapes. For noisy data, it is best to
Pandemonium architecture
Pandemonium architecture is a theory in cognitive science that describes how visual images are processed by the brain. It has applications in artificial intelligence and pattern recognition. The theory was introduced by the artificial intelligence pioneer Oliver Selfridge in his 1959 paper "Pandemonium - A Paradigm for Learning". It describes the process of object recognition as the exchange of signals within a hierarchical system of detection and association, the elements of which Selfridge metaphorically termed "demons". This model is now recognized as the basis of visual perception in cognitive science. Pandemonium architecture arose in response to the inability of template matching theories to offer a biologically plausible explanation of the image constancy phenomenon. Contemporary researchers praise this architecture for its elegancy and creativity; that the idea of having multiple independent systems (e.g., feature detectors) working in parallel to address the image constancy phenomena of pattern recognition is powerful yet simple. The basic idea of the pandemonium architecture is that a pattern is first perceived in its parts before the "whole". Pandemonium architecture was one of the first computational models in pattern recognition. Although not perfect, the pandemonium architecture influenced the development of modern connectionist, artificial intelligence, and word recognition models. == History == Most research in perception has been focused on the visual system, investigating the mechanisms of how we see and understand objects. A critical function of our visual system is its ability to recognize patterns, but the mechanism by which this is achieved is unclear. The earliest theory that attempted to explain how we recognize patterns is the template matching model. According to this model, we compare all external stimuli against an internal mental representation. If there is "sufficient" overlap between the perceived stimulus and the internal representation, we will "recognize" the stimulus. Although some machines follow a template matching model (e.g., bank machines verifying signatures and accounting numbers), the theory is critically flawed in explaining the phenomena of image constancy: we can easily recognize a stimulus regardless of the changes in its form of presentation (e.g., T and T are both easily recognized as the letter T). It is highly unlikely that we have a stored template for all of the variations of every single pattern. As a result of the biological plausibility criticism of the template matching model, feature detection models began to rise. In a feature detection model, the image is first perceived in its basic individual elements before it is recognized as a whole object. For example, when we are presented with the letter A, we would first see a short horizontal line and two slanted long diagonal lines. Then we would combine the features to complete the perception of A. Each unique pattern consists of different combination of features, which means those that are formed with the same features will generate the same recognition. That is, regardless of how we rotate the letter A, is still perceived as the letter A. It is easy for this sort of architecture to account for the image constancy phenomena because you only need to "match" at the basic featural level, which is presumed to be limited and finite, thus biologically plausible. The best known feature detection model is called the pandemonium architecture. == Pandemonium architecture == The pandemonium architecture was originally developed by Oliver Selfridge in the late 1950s. The architecture is composed of different groups of "demons" working independently to process the visual stimulus. Each group of demons is assigned to a specific stage in recognition, and within each group, the demons work in parallel. There are four major groups of demons in the original architecture. The concept of feature demons, that there are specific neurons dedicated to perform specialized processing is supported by research in neuroscience. Hubel and Wiesel found there were specific cells in a cat's brain that responded to specific lengths and orientations of a line. Similar findings were discovered in frogs, octopuses and a variety of other animals. Octopuses were discovered to be only sensitive to verticality of lines, whereas frogs demonstrated a wider range of sensitivity. These animal experiments demonstrate that feature detectors seem to be a very primitive development. That is, it did not result from the higher cognitive development of humans. Not surprisingly, there is also evidence that the human brain possesses these elementary feature detectors as well. Moreover, this architecture is capable of learning, similar to a back-propagation styled neural network. The weight between the cognitive and feature demons can be adjusted in proportion to the difference between the correct pattern and the activation from the cognitive demons. To continue with our previous example, when we first learned the letter R, we know is composed of a curved, long straight, and a short angled line. Thus when we perceive those features, we perceive R. However, the letter P consists of very similar features, so during the beginning stages of learning, it is likely for this architecture to mistakenly identify R as P. But through constant exposure of confirming R's features to be identified as R, the weights of R's features to P are adjusted so the P response becomes inhibited (e.g., learning to inhibit the P response when a short angled line is detected). In principle, a pandemonium architecture can recognize any pattern. As mentioned earlier, this architecture makes error predictions based on the amount of overlapping features. Such as, the most likely error for R should be P. Thus, in order to show this architecture represents the human pattern recognition system we must put these predictions into test. Researchers have constructed scenarios where various letters are presented in situations that make them difficult to identify; then types of errors were observed, which was used to generate confusion matrices: where all of the errors for each letter are recorded. Generally, the results from these experiments matched the error predictions from the pandemonium architecture. Also as a result of these experiments, some researchers have proposed models that attempted to list all of the basic features in the Roman alphabet. == Criticism == A major criticism of the pandemonium architecture is that it adopts a completely bottom-up processing: recognition is entirely driven by the physical characteristics of the targeted stimulus. This means that it is unable to account for any top-down processing effects, such as context effects (e.g., pareidolia), where contextual cues can facilitate (e.g., word superiority effect: it is relatively easier to identify a letter when it is part of a word than in isolation) processing. However, this is not a fatal criticism to the overall architecture, because is relatively easy to add a group of contextual demons to work along with the cognitive demons to account for these context effects. Although the pandemonium architecture is built on the fact that it can account for the image constancy phenomena, some researchers have argued otherwise; and pointed out that the pandemonium architecture might share the same flaws from the template matching models. For example, the letter H is composed of 2 long vertical lines and a short horizontal line; but if we rotate the H 90 degrees in either direction, it is now composed of 2 long horizontal lines and a short vertical line. In order to recognize the rotated H as H, we would need a rotated H cognitive demon. Thus we might end up with a system that requires a large number of cognitive demons in order to produce accurate recognition, which would lead to the same biological plausibility criticism of the template matching models. However, it is rather difficult to judge the validity of this criticism because the pandemonium architecture does not specify how and what features are extracted from incoming sensory information, it simply outlines the possible stages of pattern recognition. But of course that raises its own questions, to which it is almost impossible to criticize such a model if it does not include specific parameters. Also, the theory appears to be rather incomplete without defining how and what features are extracted, which proves to be especially problematic with complex patterns (e.g., extracting the weight and features of a dog). Some researchers have also pointed out that the evidence supporting the pandemonium architecture has been very narrow in its methodology. Majority of the research that supports this architecture has often referred to its ability to recognize simple schematic drawings that are selected from a small finite set (e.g., letters in the Roman alphabet). Evidence from these types of exper
Figure AI
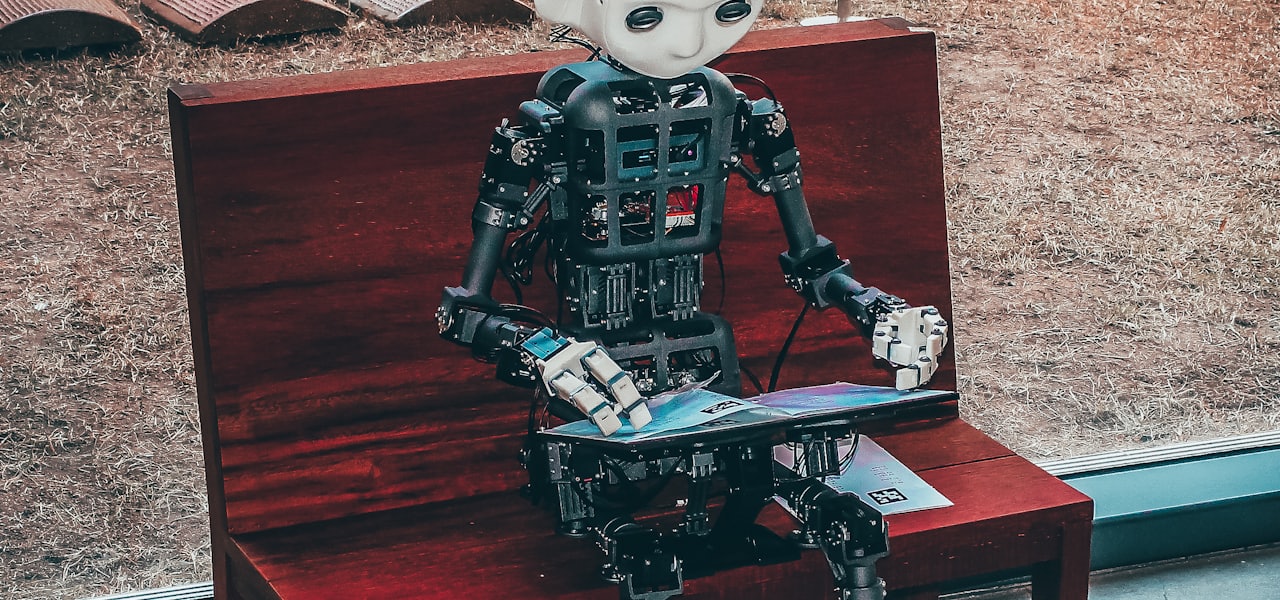
Figure AI, Inc. is an American robotics company developing humanoid robots that operate via artificial intelligence. The company was founded in 2022 by Brett Adcock. As of late 2025, the company has a $39 billion valuation. Three generations of humanoid robots (Figure 01–03) have been developed, as well as two iterations of a vision-language-action model (Helix 01–02), which can control up to two robots at once. By 2026, the robots demonstrated the potential ability to perform household work and the company gained publicity when a Figure 03 appeared at a White House event. == History == Figure AI was founded in 2022 by Brett Adcock, also known for founding Archer Aviation and Vettery. That year, the company introduced its prototype, Figure 01, a bipedal robot designed for manual labor, initially targeting the logistics and warehousing sectors. The initial model utilized external cabling for easier maintenance. In May 2023, Figure AI raised $70 million from investors including Adcock, who invested $20 million, and Parkway Venture Capital. In January 2024, Figure AI announced a partnership with BMW to deploy humanoid robots in automotive manufacturing facilities. In February 2024, Figure AI secured $675 million in venture capital funding from a consortium that includes Jeff Bezos, Microsoft, Nvidia, Intel, and the startup-funding divisions of Amazon and OpenAI; the company was then valued at $2.6 billion. Figure AI also announced a partnership with OpenAI, which would build specialized artificial intelligence (AI) models for Figure AI's humanoid robots, enabling its robots to process language; the collaboration ended after a year, with Adcock stating that large language models had become a smaller problem compared to those allowing for "high rate robot control". In August 2024, the company introduced Figure 02, describing it as the next step toward deploying humanoids for industrial use. The machine has 35 degrees of freedom (DOF), while the five-fingered hands have 16 DOF and the ability to carry up to 25 kilograms (55 lb). The model is equipped with cabling integrated into the limbs, a torso-placed battery, six RGB cameras, and an onboard vision-language-action (VLA) model. It has three times the computing power (including inference AI) of the previous model, including two graphics processing units, supported by Nvidia. Microphones, speakers, and custom AI models (developed with OpenAI) enable communication with humans. In early 2025, Figure AI announced BotQ, a manufacturing facility aiming to produce 12,000 humanoids per year with the help of its own humanoid robots, and Helix, a VLA model that can control up to two robots at once. Helix enables a robot to interact with the world without extensive manual training, according to the company allowing it to pick up nearly any small household object. By April, the company issued cease-and-desist letters to at least two secondary brokers promoting its private stock without authorization. In September, a third round of financing exceeded $1 billion, raising the company's total valuation to $39 billion. Investors included Brookfield Asset Management, Intel, Macquarie Capital, Nvidia, Parkway Venture Capital, Qualcomm, Salesforce, and T-Mobile. In October 2025, Figure 03 was introduced. According to the company, its hardware and software redesign aims to create a general-purpose robot able to learn directly from humans. An upgraded camera system delivers twice the frame rate, a quarter the latency, and a 60% wider field of view, in addition to a camera in each hand. Tactile sensors in the fingertips can detect forces as little as 3 grams (0.1 oz). It incorporates soft materials and a protected battery for safety, and removable, washable textiles. It supports wireless inductive charging. In November 2025, the former head of product safety sued the company on the basis of being fired for raising the concern that the company's robots were strong enough to fracture a human skull. By early 2026, Figure 02 had been used in demonstrations showing that it could load a washing machine, sort packages, and fold laundry. That January, Helix 02 was released, expanding the AI model to the entire body to allow for functional autonomy. A Helix 02–powered Figure 02 was shown to be capable of loading and unloading a dishwasher, based on hours of motion-capture data and simulation-based machine learning. In March, U.S. First Lady Melania Trump appeared at the White House with a Figure 03, promoting the presumptive eventual ability of AI to teach children. In May 2026, Figure AI livestreamed a group of their robots processing packages nonstop for almost a week, inspiring a 10-hour competition between their robot and a human, in which the robot performed 98.5% as well as the human.
Showbox.com
Showbox is an online video streaming platform that enables users to stream and download many videos, commonly movies and TV shows, for free. == History == The company opened the platforms to users who registered from its beta in late 2015. The platform was officially launched in February 2016, enabling any visitor to sign up and create videos online. In April 2016, Showbox was featured on the Product Hunt website, coming to the top of the website's lists for that day and week with over 1400 upvotes from the Product Hunt community. Also in April 2016, Showbox partnered with YouTube's leading multi-channel networks, including Fullscreen, BroadbandTV, StyleHaul, AwesomenessTV, and BuzzMyVideos, to enable their communities of creators to access the platform. In June 2016, the company launched Showbox For Brands, a business-oriented video creation platform, enabling companies to create video content in-house and with their communities and influencers. In March 2017, the company launched Showbox Engage, a use case of its B2B product launched in 2016, enabling companies to launch user-generated content campaigns with their communities. In April 2017, Showbox and the United Nations announced a partnership around the 70th anniversary of the declaration of human rights, with an annual, ongoing global campaign in 135 languages, inviting people worldwide to create their part of the declaration in a video from anywhere around the world. In November 2017, Showbox partnered with the Ad:tech and Digital Marketing World Forum conferences (DMWF) in New York to provide their users and communities with a User Generated Content video solution. == Technology == Showbox's video creation technology includes an online green screen feature, proprietary computer vision algorithms, deep learning technology to support the automatic creation of videos in the cloud, and advanced video composition, including special effects. == Coverage and awards == In March 2015, Showbox was nominated as one of the 10 Israeli startups to take over our TV screens this year. In July 2016, Showbox won the Publicis90 award as part of Publicis' "global initiative to foster digital entrepreneurship". In March 2017, Showbox was chosen as one of The Culture Trip's 10 startups to watch for in 2017.
Graphics suite
A graphics suite is a software suite for graphics work that are distributed together. The programs are usually able to interact with each other on a higher level than the operating system would normally allow. There is no hard, fast rule regarding the programs to be included in a graphics application suite, but most will include at least a bitmap graphics editor and a vector graphics editor. In addition to these, the suite may contain VRML editors, animation editors, and morphing tools.
Metigo
metigo is a software application that performs image-based modelling and close range photogrammetry. It produces rectified imagery plans, true ortho-projections on planar, cylindric and conic surfaces, 3D photorealistic models, measurements from photography and mappings on a photographic base for uses in the cultural heritage sector, mainly conservation. == Products == The metigo product line currently consists of the mapping software metigo MAP, the stereo-photogrammetry modeling software metigo 3D, the free viewer metigo VIEW. These products are all standalone and are not depending on other software, such as AutoCAD. === metigo MAP === metigo MAP is mainly used to map findings and conservation measured on a uniform metric photographic base. Therefore, photos of planar surfaces can be rectified based on geometrical informations, e.g. height and width of a rectangle, or cartesian coordinates measured by total station. Beside rectified imagery several other metric mapping bases can be imported and used: true ortho-projections; scaled scans of plans and plots; CAD-files; 3D models, such as digital surface models (DSM) produced by stereo-photogrammetry, SfM or 3D scanning. metigo MAP 's strong point is that rectified imagery taken with different techniques (visual light, sided light, IR, UV, UV-fluorescence, X-ray), historic images and photos taken at various stages of the conservation process can be superimposed and evaluated mutually. The user can allocate several attributes, such as different conservation measures and damage classes, to the mapped geometries. The mappings can be analysed by geometries as well as by user-defined attributes at any stage of the project. metigo MAP targets mainly conservators in different cultural heritage fields. Using it no specialist knowledge of surveying and photogrammetric techniques are needed. === metigo 3D === metigo 3D is a stereo-photogrammetric kit that allows to calculate bundle adjustments (axios3D), create high-quality 3D point clouds using multiple stereo photo pairs combined with metric survey data, mesh these point clouds, texture the meshes with high-resolution image data to create photo-realistic models, ortho-project orientated images on digital surface models (DSM) on planes and best-fit cylinders and cones, create unwrappings and developed views of curved surfaces, analyse deformations of 3D surfaces. metigo 3D targets metric survey specialists working in the cultural heritage sector. == Supported file formats == metigo has the ability to read the following formats: images: JPEG (.jpg), Tiff (.tif), Bitmaps (.bmp), CompuServ (.gif), Encapsualated Postscript (.eps), PCX (.pcx), Photo-CD (.pcd), PICT (.pcd), PNG (.png), Targa (.tga), RAW-format of several camera brands. CAD: DBX, DXF, DWG. 3D: many ASCII-formats (.stl, .wrl, etc.) point data: format editor for ASCII files. == Supported languages == Currently, an English and German version of the software is supported. For metigo MAP beside these a French and Polish GUI is offered for sale. == Applications == The main applications of metigo are: conservation in the cultural heritage context, e.g. stone conservation paintings tapestry etc. architecture, archaeology, many other are possible, e.g. forensics. == History == The first public release of metigo was in 2000.